Technology
floodlight and Python data stack for analysis; web dashboards for interactive exploration.
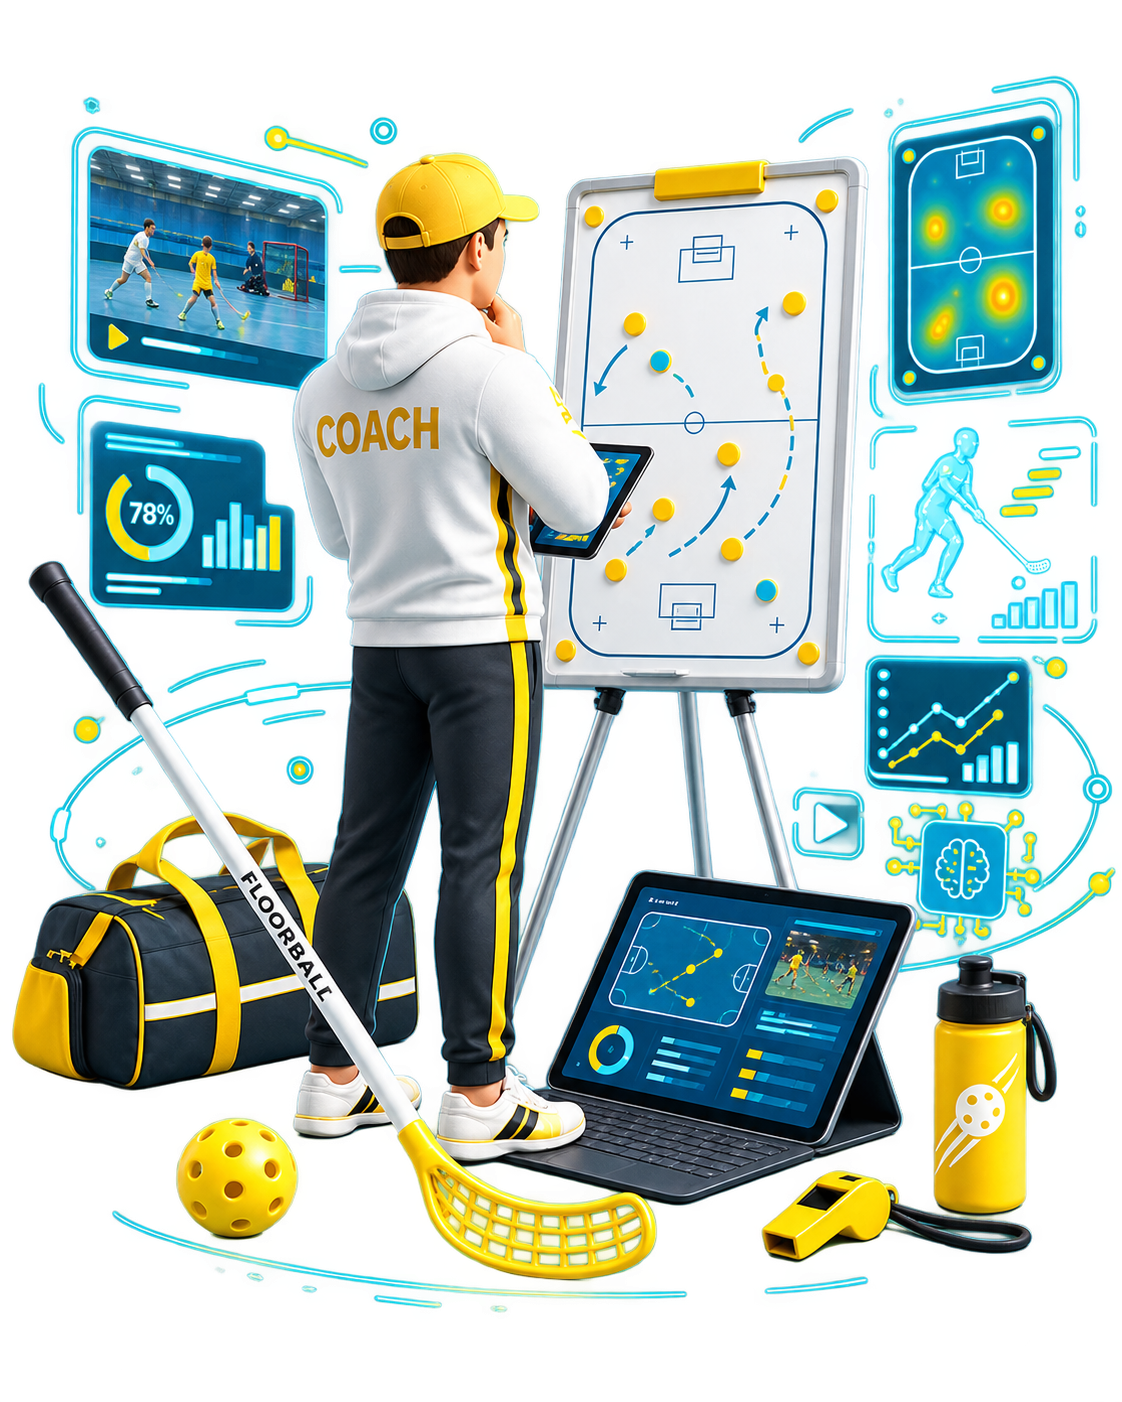
Combine event and tracking data into coaching questions.
Create shot maps, heatmaps, event summaries, player movement, team spacing and trend views from structured data.
floodlight and Python data stack for analysis; web dashboards for interactive exploration.
Start with a small browser prototype, keep the data model explicit, then connect the analysis backend as separate API services. Validate results with coaches before automating scoring.
This is a front-end concept demo. It does not yet send video or personal data to a server.